


A table, bar graph or line graph can look straightforward at first glance, until it appears in a PSLE Mathematics paper with several lines of information and a multi-step question underneath. Many Primary 6 pupils can add, subtract and calculate percentages confidently, yet still lose marks because they read the wrong row, miss a unit or apply the right operation to the wrong values.
Answering PSLE Maths data analysis questions is not only about calculation. It is about understanding what the information is showing, selecting the values that matter and presenting clear working under exam pressure. This guide gives pupils and parents a repeatable way to handle graphs, tables and data-based word problems.
Key Takeaways
- Read the question before hunting for numbers. Knowing exactly what must be found stops pupils from copying every number in a busy graph or table.
- Check titles, labels, keys and units first. A value may represent pupils, kilograms, dollars or minutes, while a scale may increase by 2, 5, 10 or 100.
- Match the operation to the full wording. “Altogether” often requires addition, while “how many more” requires subtraction. Some questions need both, in separate steps.
- Show enough working to make the method clear. Short number sentences help pupils spot mistakes and communicate their reasoning.
- Treat data questions as word problems supported by evidence. Data interpretation can involve totals, differences, averages, fractions and percentages.
- Practise short, focused sets with correction. During PSLE Mathematics revision, a few carefully reviewed questions are more useful than rushing through a large worksheet.
What PSLE Maths Data Analysis Questions Test
Reading data is only the starting point
PSLE Maths data analysis questions may use tables, picture graphs, bar graphs, line graphs or real-world scenarios. A pupil may need to compare quantities, calculate a total or difference, find an average, work out a percentage, or use graph information in a longer problem-solving question.
For example, a table may show recycling bags collected by four Primary 6 classes. The question may first ask for the total collected by two classes, then ask what percentage of the overall collection came from one class. Reading the figures may be quick, but the mathematical reasoning begins after that.
This is why a child can say, “I understand the graph,” and still get the final answer wrong. They may have correctly read 36 bags, then divided by the wrong total. Understanding the display and using the information correctly are two different skills.

Where these skills appear in PSLE Maths
Data interpretation can appear in short-answer and longer problem-solving questions. It tests reasoning, communication and accuracy, not simply fast graph reading. Parents should check current assessment details through MOE and SEAB, as syllabus and examination requirements may change.
Tutors often notice that a child’s arithmetic is sound, but their eyes jump from the question to the first familiar-looking number. Under time pressure, pupils may rush the reading stage because they want to “start doing Maths”.
A common pattern among students is that the mistake happens before any calculation begins. Building a calm reading routine is therefore just as important as practising calculations.
Read the Task Before Looking Closely at the Data
Underline what the question is asking
Read the question once before calculating. Circle the action word and underline the quantity required.
The wording matters. “Altogether” usually signals a total, while “how many more” asks for a comparison. Still, pupils should avoid relying on one key word alone. A longer question may contain several steps, and the first operation may not be the final one.
Turn the wording into a mini-plan
A helpful habit is writing a short note beside the question, such as “find total first” or “compare Tuesday and Thursday”. This takes only a few seconds and prevents a familiar PSLE Maths error, completing a sensible calculation that does not answer the question.
Imagine a graph showing kilometres cycled over five days. If the question asks, “How many more kilometres were cycled on Friday than on Monday and Tuesday altogether?”, a hurried pupil may subtract Monday from Friday. A careful reader sees that Monday and Tuesday must first be added.
After CCA and homework, children may be tempted to solve every question at speed. For data questions, the first few seconds should be spent reading, not calculating. Speed becomes useful only after accuracy is secure.
Inspect Labels, Units and Scale Carefully
Read the title, headings and units
The title explains what is being measured. Column headings show categories, while units give meaning to each value. Missing one small detail can change the answer completely.
A table headed “Amount raised, in tens of dollars” does not mean 28 represents $28. It represents $280. Likewise, a graph labelled “Number of bottles, in hundreds” means a bar reaching 7 represents 700 bottles.
Before extracting figures, pupils should ask:
1. What is being counted or measured?
2. What does one interval, square or symbol represent?
3. Which category, day or group does the question mention?
Check the scale instead of guessing
PSLE graphs may use scales that do not increase by one. A vertical axis may show 0, 20, 40 and 60, while each smaller grid line represents 10. Children may assume a bar is 50 without checking the intervals, or choose the nearest labelled value instead.
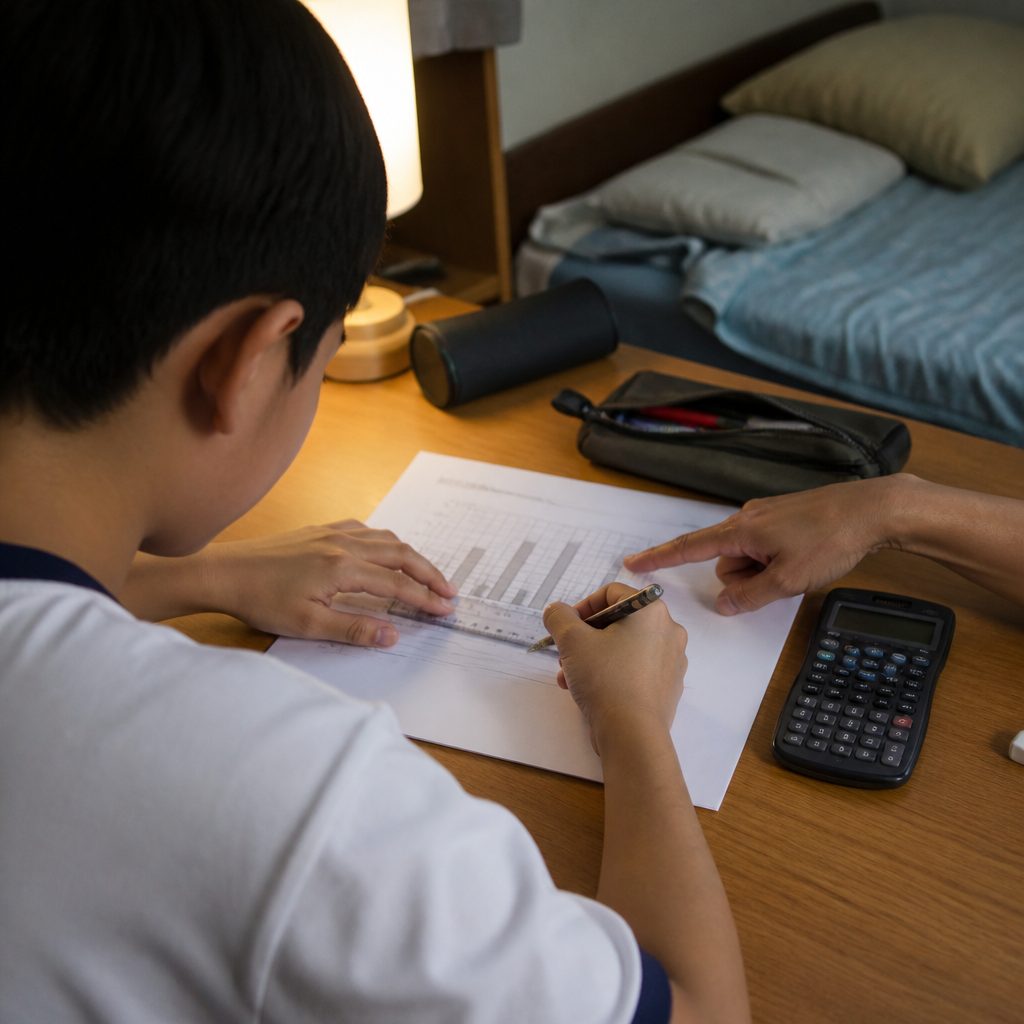
Use a finger or ruler to trace from the top of the bar across to the axis. For a line graph, trace vertically down from the plotted point rather than diagonally towards a nearby label.
A practical home activity is to cover the questions on a worksheet and ask your child to state three values from the graph, including their units. If they cannot do this accurately, more calculation practice will not solve the underlying problem.
Select the Right Information and Operation
Copy only the values you need
Not every value in a data display belongs in the calculation. Encourage pupils to write a short data list before solving multi-step questions.
For example, a school carnival table may show:
If asked what percentage of fruit cups were sold by 6B and 6D together:
6B + 6D = 60 + 40 = 100
Total sold = 45 + 60 + 35 + 40 = 180
Percentage = 100 / 180 x 100% = 55.6%), if the question asks for an appropriate rounding format.
The key point is not the percentage alone. Pupils must identify that 6B and 6D form the part, while all four classes form the whole.
Watch for multi-step traps
Pupils can make mistakes when they choose an operation from one key word and stop thinking. “Remaining” may involve subtraction, but they may first need to find a total. “Average” requires adding the relevant values before dividing.
If a line graph shows water consumption over four days and Thursday is 15 litres more than Wednesday, pupils must first read Wednesday accurately before finding Thursday. If the question then asks for a total, each later step depends on the earlier one.
Encourage children to write one equation for each step instead of squeezing everything into one long line. It may look slower, but it reduces lost marks when a later answer relies on an earlier value.
Show Working and Check the Answer
Make the method visible
A final answer alone gives no clue whether a pupil misread the graph or made an arithmetic slip. Clear working is particularly valuable in longer PSLE Maths questions.
Instead of writing only “27”, show:
Number on Saturday = 52 − 25 = 27
This tells both the marker and the pupil what 27 represents. Include units in the final answer, such as “27 pupils”, “$27” or “27 minutes”.
Use a quick reasonableness check
Before moving on, pupils should ask:
- Is the answer larger or smaller than it should be? A difference should be smaller than both original quantities.
- Does the unit match? A graph in hundreds cannot usually produce an answer of “8 bottles” unless a later calculation changes the unit.
- Did I answer the exact question? Finding a total does not answer a question asking for an average.
For percentages, the answer should usually fall between 0% and 100% when it represents part of a whole. For averages, the result should generally lie between the smallest and largest values.
These exam habits matter most when nerves are high. A pupil who finishes early is often better served by checking labels, scale and units than by redoing every sum from scratch.
Common Data Analysis Mistakes and How to Avoid Them
Reading the wrong row, bar or point
Crowded tables can cause pupils to drift one row down, especially when tired. Use a ruler to follow the correct row. On a bar graph, touch the category label first, trace up to the bar, then trace across to the scale.
Ignoring a key or conversion
If a picture graph key says one symbol represents five pupils, every symbol must be interpreted using that key. Likewise, values given in tens, hundreds or thousands require conversion before calculation. Pupils should say the unit aloud before writing the number.
Choosing an operation from one word
“Difference” does suggest subtraction, but only after the correct two values have been identified. “Average” does not mean dividing the largest value by the number of days. Listing the relevant values first makes the intended operation clearer.
Giving too little working
Some children erase planning because they want their paper to look neat. Neatness helps, but invisible thinking is risky. Keep working in short, organised lines and cross out an error once instead of repeatedly rubbing out until the page becomes confusing.
If your child understands corrections but repeats mistakes in timed work, personalised support may help identify whether the difficulty is reading accuracy, number sense or exam habits. Learn more about personalised Mathematics support for help building data-analysis skills, revision routines and confidence.
A Short PSLE Mathematics Revision Checklist
Before submitting a data question, pupils can check:
- Read the whole question. State what must be found, for example, “I need the percentage from two classes, not the total number.”
- Check the title, labels, key and units. If the graph is in hundreds or the table is in minutes, write that down.
- Trace and list the exact values needed. This reduces the chance of using a nearby bar or wrong column.
- Plan the calculation in steps. For a percentage, identify the part and whole before dividing.
- Show number sentences. Give the final answer with the correct unit.
- Check whether the answer is reasonable. Pause before moving on.
Short practice works best when it includes review. After three questions, ask, “Which step caused the mistake?” “Careless” is rarely specific enough. Was the scale misread? Was the wrong whole used? A clear answer guides the next revision session.
Frequently Asked Questions
How often should my child practise PSLE Maths data analysis if they keep making careless mistakes?
Two or three short sessions each week can be effective when each session includes correction. During PSLE Mathematics revision, use a mix of tables, bar graphs, line graphs and multi-step questions rather than repeating only the easiest format.
My child reads graph values correctly but still loses marks. Why?
The difficulty may be choosing operations or managing multi-step reasoning. Ask your child to label the “part”, “whole”, “total” or “difference” before calculating. This helps reveal whether they understand what each value is for.
Should my child memorise a method for every data question?
No. A rigid script can backfire when question formats change. A repeatable process is more useful: understand the task, inspect the data display, select values, calculate, show working and check the answer.
Are data analysis questions only about graphs?
No. Tables, keys, charts and real-world word problems can all test the same skills. A table question may involve averages or percentages, while a graph question may require several linked calculations.
Conclusion
Knowing how to answer PSLE Maths data analysis questions gives pupils a calmer way to approach information-heavy problems. Read the task before calculating, inspect labels and scales, extract only the needed values, choose operations carefully, show each step and check that the final answer makes sense.
The goal is not to rush through data interpretation. It is to become accurate enough that graphs and tables feel like evidence to use, not a page of numbers to fear. For children who remain stuck despite regular practice, personalised Mathematics tuition support can help strengthen revision confidence and the habits behind accurate problem solving.