


A graph with several lines, a busy topographical map, or a photograph of an unfamiliar landscape can make an O-Level Geography question feel far tougher than it is. After CCA, homework and revision, many students end up staring at the source, copying a few figures and hoping that will be enough.
Strong performance in O-Level Geography data-response questions is not about memorising impressive paragraphs. It comes down to reading sources carefully, choosing precise evidence and explaining what that evidence means geographically. These are practical exam skills, and they improve with deliberate practice.
For parents, this can be especially frustrating. Your child may know the chapter content, yet still lose marks because they describe a graph without explaining it, miss an anomaly, or do not refer closely enough to the map. This guide breaks down how to approach maps, graphs and evidence with greater confidence.
Key Takeaways
- Read the command word first. “Describe”, “compare” and “explain” need different answers. Explaining when description is enough can waste exam time, while describing without explaining may miss higher-level marks.
- Quote evidence precisely. Use figures, units, place names, grid references or source details. “It increased a lot” is much weaker than stating that rainfall rose from 24 mm to 68 mm.
- Move beyond copied data. A good graph answer identifies a trend or comparison, then explains what it suggests about the geographical process or pattern when the question requires it.
- Treat maps as evidence, not decoration. Relief, land use, drainage, settlement and transport features can support a conclusion when they are read together.
- Notice unusual results. An anomaly can be worth mentioning when it challenges an otherwise clear trend or comparison.
- Practise under time limits. A student may understand a source at home but struggle when rushed in the examination. Short, focused source drills are often more useful than rereading notes.
What Geography Data-Response Questions Really Test
Sources test thinking, not just memory
O-Level Geography assessment includes geographical information such as maps, photographs, graphs, tables and other data sources. In data-response questions, students are usually tested on whether they can identify patterns, use evidence accurately and apply geographical knowledge to interpret what they see.
A question may ask a student to describe the distribution of rainfall, compare two locations, suggest why a settlement developed in one area, or evaluate whether evidence supports a claim. Whether the topic is physical or human geography, the core skill is the same: make a point, prove it from the source, then explain it where required.
Students often revise content chapter by chapter, then treat data response as a separate “trick”. It is not. A drainage pattern on a map can connect to relief. A bar graph on visitor numbers can connect to tourism impacts. A photograph of coastal protection can connect to erosion management.
Match the answer to the command word
The command word tells students what the examiner needs from them. Getting this wrong can make even a well-written answer miss the point.
For example, if a graph shows that water use is higher in Location A than Location B, “A uses more water” is description. “A may have greater domestic demand because it has a larger population” is an explanation, provided the source or question context supports that inference.
Check the latest syllabus and school guidance, as requirements and source formats may be updated. SEAB’s 2026 O-Level Geography syllabus and the SEAB O-Level syllabus page are useful official starting points.
Read Graphs With Accuracy and Purpose
Start with the essentials
Before writing, students should check the title, axes, key, units and dates. Skipping these details causes avoidable errors, especially when a graph uses percentages rather than actual numbers or combines several categories.
Imagine a line graph showing monthly rainfall at two locations. A student should first look for the overall pattern, a clear comparison, exact supporting evidence and any exception.
A stronger response could read: “Rainfall at Location A generally increased from 60 mm in January to 140 mm in March, before falling afterwards. It was higher than Location B in most months, although Location B recorded slightly more rainfall in June.”
The figures have units, the comparison is clear, and the exception is not ignored.
Calculate only when it adds value
Some O-Level Geography data-response questions require a difference, percentage change or ratio. Show the working clearly, then use the result in a sentence. If tourist arrivals rose from 40,000 to 55,000, the difference is 15,000 visitors. The important part is stating what that difference shows, rather than leaving “15,000” floating without context.
A common pattern among students is calculating every possible figure because it feels safer. In reality, that can burn time and hide the main trend. Calculate when the question asks for it or when the number makes a comparison more convincing.
Make Map Evidence Work Harder
Read features in combination
A map question rarely rewards listing symbols one by one. Map interpretation becomes stronger when features are connected. A student may notice contour lines, a river, roads and buildings, then infer why people use the land in a particular way.
For instance, closely spaced contours indicate steep slopes. If a settlement is located on flatter land beside a road but away from the steepest slopes, a sensible explanation is that flatter, accessible land is more suitable for building and transport. The map evidence supports the conclusion.
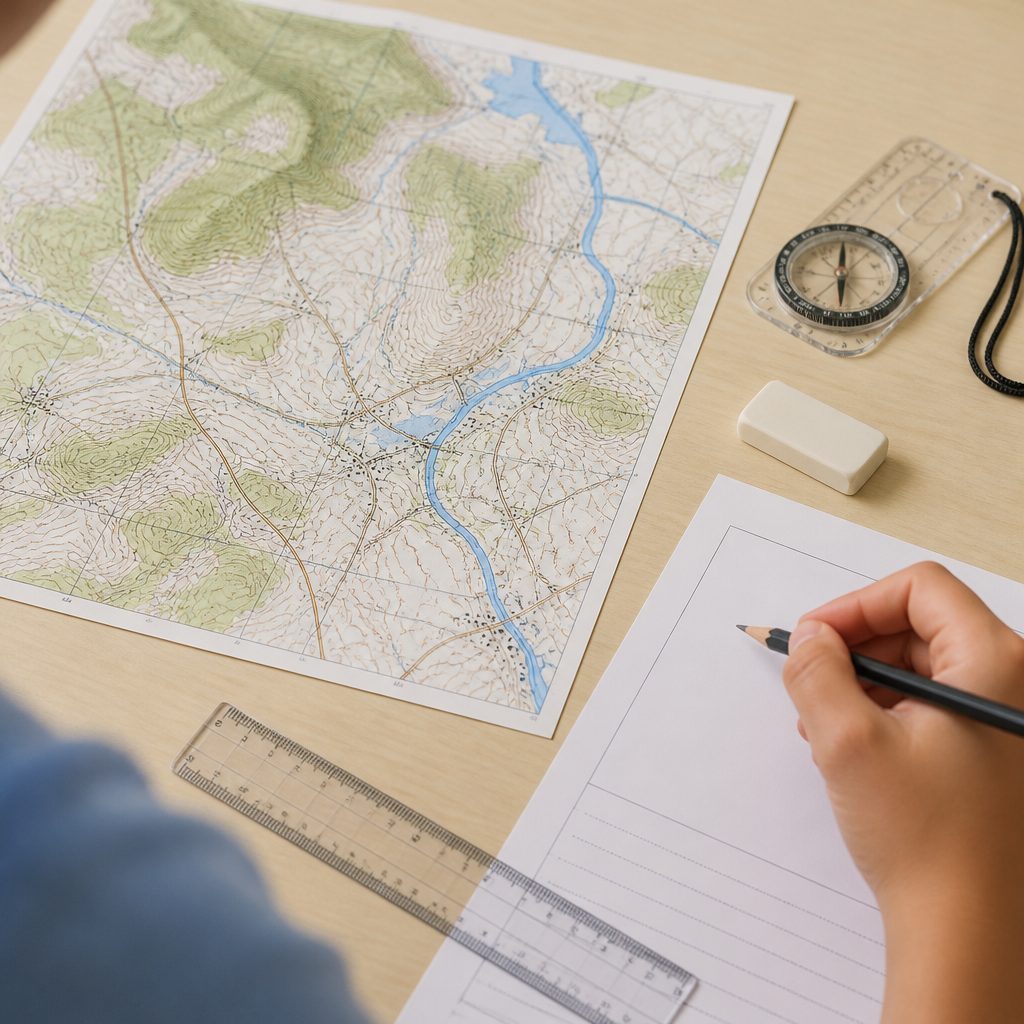
Each observation needs a purpose. “There is a road” is basic. “The settlement is accessible because it lies beside a main road and bridge crossing” uses map evidence to answer a geographical question.
Avoid unsupported assumptions
Students sometimes see green shading and write “forest”, or see buildings and conclude “high-income housing”. Unless the key or source confirms it, that is an unsupported guess. When evidence is limited, cautious wording such as “the area appears vegetated” is safer.
Parents may recognise this pattern: a child can sound fluent when discussing a map aloud, but their written answer contains assumptions they cannot prove. Encourage them to ask, “Which exact map feature supports this sentence?” That one question builds more reliable evidence-based answers.
Turn Evidence Into Explanation
Show why the evidence matters
The difference between a middling and stronger answer is often one extra sentence. Copying figures is not analysis. After quoting data, students need to explain the pattern using the relevant geographical concept.
Consider a table showing that the highest temperatures occur in a built-up location, while a park records lower temperatures.
A weak response says, “The built-up location is 3°C hotter.”
A stronger response says, “The built-up location is 3°C hotter than the park, possibly because concrete and buildings absorb and retain more heat, while vegetation provides shade and cooling.”
The source provides the evidence. Geographical knowledge provides the explanation.
Use a repeatable structure for longer answers
For questions that need explanation, students can use this sequence:
1. Make a direct point. Answer the question clearly.
2. Support it with source evidence. Include a precise detail.
3. Explain the geographical reason or consequence. Show why the evidence matters.
4. Add another developed point if needed. Let the marks guide the depth of the answer.
For example: “Flood risk may be higher near the river because the map shows low-lying land beside the river channel. During heavy rainfall, water can overflow onto the flatter floodplain.” This is more effective than several sentences that merely describe the river.
Tutors often notice students memorising model answers, then forcing them onto unrelated sources. That can backfire. Memorise useful geographical ideas, such as infiltration, accessibility or urban heat retention, but let the evidence determine which idea belongs in the answer.
Build Confidence Under Time Pressure
Practise in short, realistic bursts
A full paper is useful, but not every revision session needs to become a marathon. After a long school day, 15 minutes spent answering one graph or map question can be more productive than passively highlighting notes.
- Choose one data-response question. This keeps practice focused without the pressure of an entire paper.
- Annotate the source for two minutes. Circle trends, units, locations and anomalies before writing.
- Answer within the allocated time. Build the habit of making clear, relevant points without over-writing.
- Review the response carefully. Check whether every paragraph uses source evidence and whether every explanation matches the command word.
Parents can support without becoming the examiner. Instead of asking, “Why did you lose marks again?”, ask, “Which part was hard: reading the source, selecting evidence, or explaining it?” When a student can identify the exact gap, improvement becomes far more manageable.
Look for patterns, not only marks
Repeated errors reveal the real problem. Some students consistently miss units. Others write long answers that do not answer the question. Others identify data accurately but cannot connect it to concepts such as erosion, migration or land-use conflict.
If your child needs focused help with source reading, answer structure or timed practice, personalised Geography tuition support can provide guided feedback on recurring mistakes. Tuition cannot guarantee a grade, but targeted practice can make revision habits and exam decisions more purposeful.
Check Your Answer Before Moving On
In the final minute, run through this checklist:
- Have I answered the exact command word?
- Did I refer to the correct source?
- Did I use a figure, unit, place name or map feature where relevant?
- Have I compared both sides where required?
- Did I explain rather than simply copy?
- Have I addressed an important anomaly?
- Are calculations labelled and sensible?
This may sound basic, but it matters. Markers can only award credit for what is written. A student may understand the source perfectly but lose marks by omitting a unit, failing to state which location is higher, or giving an explanation with no evidence.
Frequently Asked Questions
How many figures should my child include in a graph answer when they panic about missing evidence?
Use enough evidence to prove the pattern, usually two or three carefully selected figures rather than every number on the graph. For a comparison, include evidence from both locations or categories.
Should students always explain a graph trend, even when they are short on time?
Only if the command word asks for explanation, reasons or causes. For a “describe” question, focus on accurate trends, comparisons and anomalies. Adding unsupported reasons can waste time.
What should my child do when the map does not give enough information?
Use only what the map supports and write cautiously. A reasonable suggestion is acceptable when invited by the question, but assumptions should not be presented as facts.
Can model answers improve Geography evidence skills without encouraging copying?
They can show how developed answers use data and explanation. However, copying them word for word is less useful than identifying why each sentence earns credit and applying that approach to a new source.
Conclusion
O-Level Geography data response becomes manageable when students read sources with purpose, select precise evidence and connect it to geographical ideas. Graphs need trends, comparisons and units. Maps need linked features, not isolated symbols. Evidence needs explanation, not copying.
With short timed practice and thoughtful feedback, students can build stronger source-analysis habits and calmer exam confidence. For personalised support with Geography revision and O-Level exam skills, learn more about our Geography tutors.